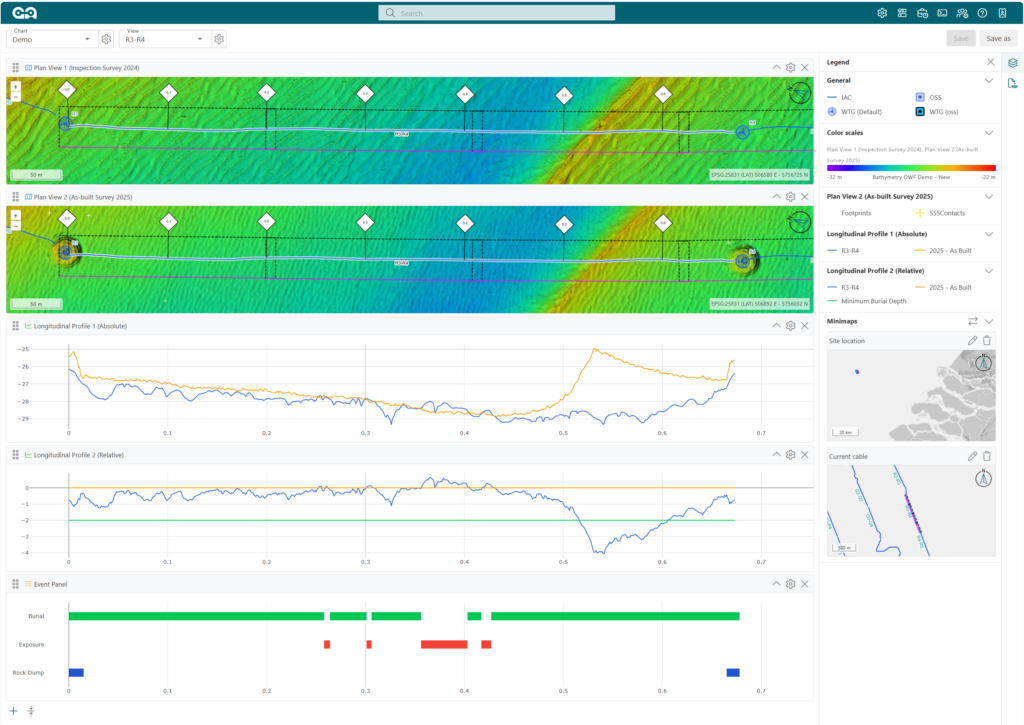
View ALL your subsea data clearly with GRIDit ALIGN. In an interactive chart, multiple data panels are displayed in a single clear, synchronised viewer, providing a complete, aligned view of asset data. Intuitive to use, GRIDit ALIGN also enables quick production of high-quality, printable alignment charts.
Pan and zoom in the Interactive Alignment Chart. All the panels move together in perfect synchrony.
Select different datasets to visualise and compare.
Follow the full length of a cable or pipeline with ease.
Identify developing problems for risk-based asset management.
Printable Alignment Charts
From project data to print-ready alignment charts with a single click.
Load the data, select a cable or pipeline, and click Generate.
Industry standard templates ensure fast, consistent chart generation.
Templates can be customised for specific project and reporting requirements.
We use cookies to make your experience of our websites better. By using and further navigating this website you accept this. Detailed information about the use of cookies on this website is available by clicking on more information.